17 Critical Sales KPIs Every Business Should Consider
Sales KPIs are vital for your business. If you can’t measure success, you can’t know whether you’re on track to achieve your strategic goals. To maximize sales, you must grasp the metrics that help monitor your progress towards a goal. Also, you need to gain insights into what you must improve to expand.
Read on to learn more about key performance indicators (KPIs) in sales and how they can help gauge and enhance your performance.
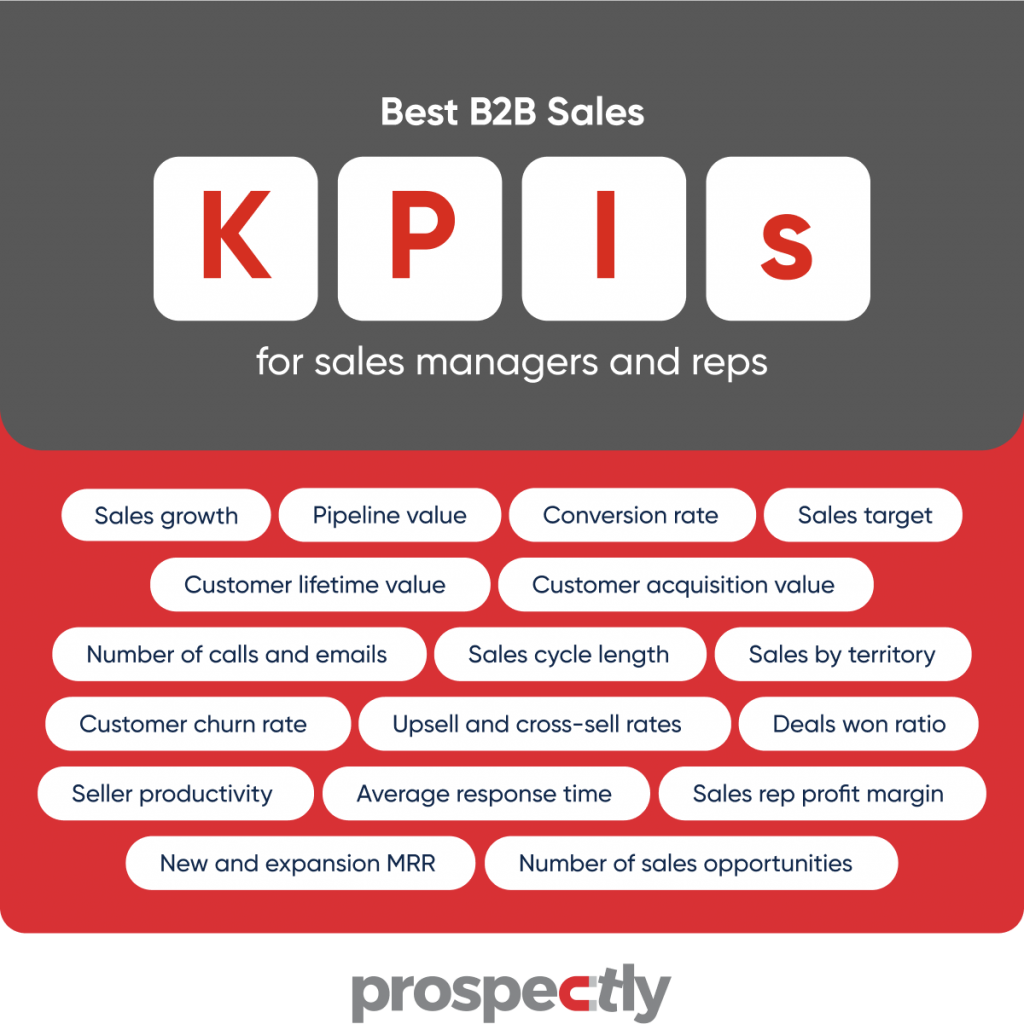
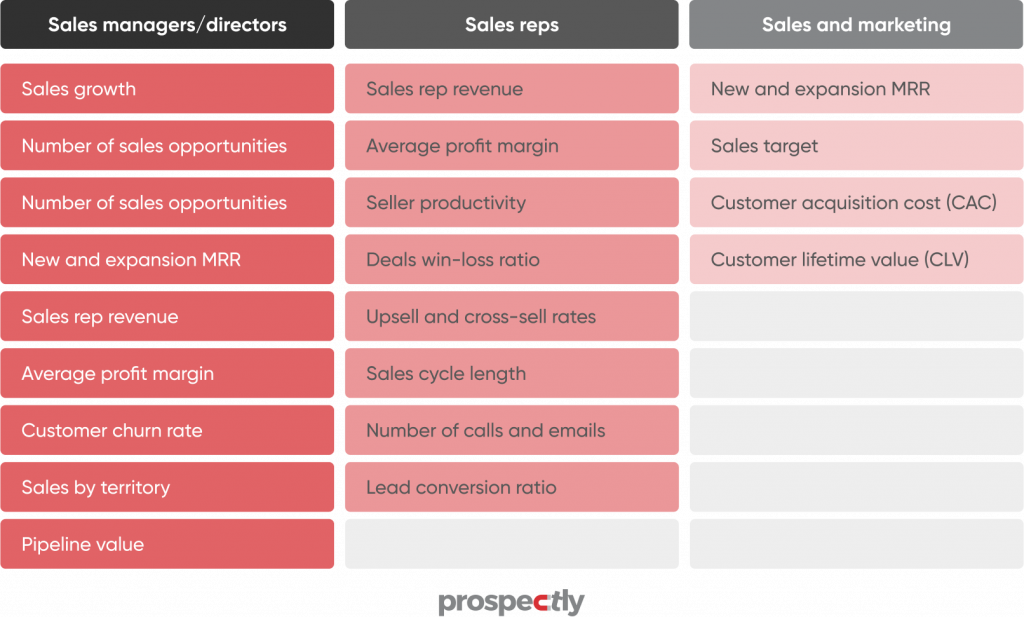
First, here’s a comprehensive list of the best B2B sales KPIs for sales managers and reps.
Sales metrics vs. Sales KPI: What’s the difference?
Are sales metrics and KPIs the same? No. A sales KPI primarily measures performance against your overall objectives or targets.
Because they’re “key,” you can see them as your roadmap to success. KPIs answer the question: Is your business on the right track to accomplish its strategic goals? For example, you could aim to boost your annual revenue by 5%.
That becomes your sales growth KPI, indicating whether you’re steering your company toward that objective. Sales KPIs are strategic.
You also need a set of metrics to monitor your B2B sales KPIs. Sales metrics are data points that zero in on business processes and tactics to achieve your KPIs.
They’re tactical. For example, the lead conversion ratio is a perfect sales metric to monitor your annual sales growth.
See more differences below.

In a nutshell, KPIs for sales can’t exist without sales metrics because you need some metrics to monitor your performance. You should also link them to strategic targets or goals.
But sales metrics can exist on their own. Finally, KPIs are metrics since they assess progress, but not all metrics are KPIs.
How does your business benefit from tracking sales KPIs or sales analytics?
Tracking KPIs in sales is critical to your business and team’s success. Here’s why?
- Sales analytics gives you a clear picture of how the business is performing, where it’s headed, and what you need to do to double revenue.
- By tracking sales KPIs, you can identify problematic areas. As a result, you can make changes before they become chronic headaches.
- Measuring and tracking KPIs lets you gain insights into how your customers respond to your products/services. You can use the info to upgrade your solution to expand your business.
- Sales analytics can help you identify trends in your sales process that could be causing issues.
- KPIs can provide valuable insights into your team’s performance and your sales strategy’s effectiveness.
- Sales KPIs measure revenue and profitability. You start spotting patterns and determining areas for improvement.
17 Sales KPIs to take your sales performance to another level
Note that not all sales KPIs on this list are relevant for your company. You must pick a few that satisfy your goals. Later on, we’ll shed some light on how you can determine which KPIs to monitor.
1. Sales growth
This sales KPI reflects how well your business is growing – its overall health. You can measure sales growth as a percentage increase in revenue, the number of new customers, or monthly orders.
A high sales growth rate shows you’re gaining traction and finding new buyers.
To achieve explosive sales growth, be specific about your growth targets over time. Clear goals will help your reps focus on what’s crucial while giving them something concrete to aim for.
Also, ensure your sales team has the right tools and resources to achieve its goals, such as CRM software.
Why it’s vital:
It shows how well you convert new customers into paying customers. In addition, sales growth indicates if your marketing efforts are working. Static sales growth is a sign that you need to adjust something in your marketing strategy.
You can use this feedback from your sales growth KPI to alter your products, strategies, or processes.
Who benefits:
Sales managers can use this sales KPI to see if their efforts bear positive results. They can use sales KPI dashboards to monitor reps’ performance, their sector, and targets.
2. Pipeline value
Your pipeline value shows the expected revenue from active sales opportunities. When it increases, it means you have more sales opportunities. And it indicates there is more potential revenue.
Why it’s vital:
You can predict sales revenue and visualize how much money you can expect from your team’s efforts. Any growth could represent newly added customers, deal status, or more time spent selling.
Compare your growth against historical values to determine if your pipeline is growing at a pace you can sustain over time.
Who benefits:
Sales leaders and their sellers can use this B2B sales KPI to assess their performance.
3. Lead conversion ratio
It’s a metric that measures how many leads you can convert into actual customers. And it’s calculated as the total number of leads divided by the number of sales made.
The ideal value for a company is 1:1, meaning that every lead generates one sale. Anything higher than 1:1 shows your team is generating more revenue than they’re losing to lead attrition.
A low value indicates that your team has trouble converting leads into sales. It could be because of poor targeting, high cost per lead, or a lack of quality leads.
Whatever the case, it’s something you need to work on to start crushing more deals and growing your business.
Why it’s vital:
Lead conversion is closely related to lead quality. Leads with high-quality scores tend to convert better than low-quality leads.
You can also optimize your website to improve lead acquisition and engagement. Ensure your team actively rejects bad leads and focuses on nurturing quality leads to reach your desired lead conversion goal.
The more qualified leads that come through your website, the higher the lead conversion rate will be.
Who benefits:
This sales KPI is an excellent resource for reps. It shows whether their pitches are effective in converting prospects into paying customers.
4. Customer lifetime value (CLV)

CLV measures how much you expect to make from a particular customer throughout their lifetime. Calculate CLV by subtracting acquisition costs from lifetime revenue per buyer. It provides an estimate of how much they’re worth to your business.
Why it’s vital:
It helps you understand how much income you make from an individual customer. You can accurately project CLV when planning revenue streams. Marketing teams can also use this tool to grasp how much to spend on acquisition vs. retention.
Who benefits:
Marketing teams and sales managers
5. Customer acquisition cost (CAC)
An acquisition cost is the cost you’re willing to pay for gaining a new customer. The sales KPI could include expenses such as sales proposal costs, research, and the rep’s hiring costs. It may also involve cold calling and sales campaign costs.
Why it’s vital:
You can use CAC to create a baseline for growth. It can determine how much you have to spend to keep up with your expansion and maintain profitability.
Also, you can decide whether it’s worth investing in new strategies like marketing automation or CRM systems. Such software would help reduce overall costs and make it cheaper to acquire new buyers.
Who benefits:
Marketing and sales department
6. Sales target
A sales target evaluates whether you’re on the path to hitting your goals. Look at the total dollar amount of sales to gauge whether you’re achieving this metric.
If it’s not where you’d like it to be, it means it needs attention. It could be that your sales team isn’t hitting their quotas.
You can also track the number of leads generated per month (or quarter) to see your progress in that area. Set benchmarks based on your past performance to see if you’re meeting your sales targets.
Why it’s vital:
If you see a decline in sales, it’s time to re-evaluate your sales process and know what you need to adjust. Are you losing touch with your target customer? Is your message not strong enough? Are you reaching out to the right people?
Who benefits:
Sales managers and marketing
7. Number of calls and emails
The number of calls and emails is a sales KPI that helps you see how active your rep is at creating new opportunities. Of course, the new leads must be in line with your buyer personas. It ensures that your salespeople pursue promising prospects.
Why it’s vital:
You can see how many calls and emails your salespeople send out and whether that matches your sales goals. And it can help you pinpoint weak spots in your sales cycle and determine how you can fix them.
Who benefits:
Sales leaders and reps can benefit from this KPI.
8. Sales cycle length
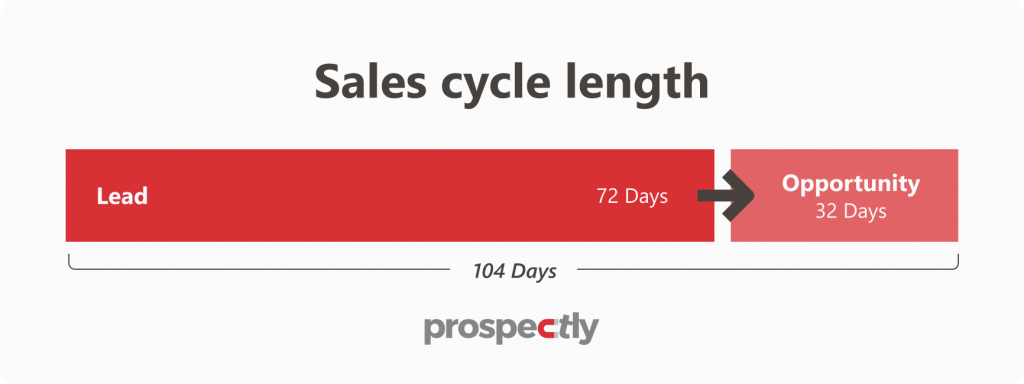
The average sales cycle length is the amount of time from your ‘initial contact’ with a prospect to ‘winning the deal’.This sales KPI tells you how long it takes sellers to convert prospects into buyers.
If your average sales cycle length is shorter, your reps can close more deals and crush their goals.
Buyers can “go cold” on your product/service – meaning they can lose interest if the sales cycle is longer. Establish a baseline and aim to reduce it over time to double sales within a short time.
Why it’s vital:
You can keep tabs on the individual seller’s performance in the long run. Shorter average sales cycles encourage potential buyers to move quickly down the sales funnel.
Who benefits:
Reps and sales managers -leaders can determine training needs.
9. Sales by territory
One of the most important KPIs for a sales executive is sales by territory. It indicates which territories generate the most revenue for your business. Also, it shows which areas you need to focus more on to expand sales.
Measure your sales by region through sales volume. Sales volume tells you how much revenue your company generates from each location.
To calculate this, simply divide your total income for a particular period (month, quarter, or year) by the number of territories.
Why it’s vital:
You can understand your customer demographics and what makes them buy or reject your products.
Who benefits:
Sales managers/directors/executives
10. Customer churn rate
Churn rate is a key sales indicator of customer loyalty. It evaluates how many customers leave in a given period, typically a month or two.
A high churn rate means your business isn’t retaining its clients and is losing them to competitors. But a low churn rate shows you can keep your customers engaged and satisfied with your service.
Divide the total number of customers you had as the month began with the number of buyers lost to get your churn rate.
Why it’s vital:
It’s critical to control the customer churn rate. It informs you about your ability to retain customers and your profitability. A higher churn rate will result in a loss of revenue.
Who benefits:
Sales managers/executives & C-suite at SaaS businesses
11. Upsell and cross-sell rates
Upsell and cross-sell rates are sales KPIs that indicate how you increase the ROI and revenue. These metrics tell you how effectively you upsell and cross-sell existing products or services to your customers.
Why it’s vital:
It’s pretty simple. Increasing the sales of your existing products or services expands the customer’s investment value. The higher your upsell and cross-sell rates, the more income you’ll generate from each buyer.
Who benefits:
Reps can use this metric to see how well they use upsell and cross-selling strategies to grow revenue.
See the following example from Udemy:

Udemy uses an up-selling strategy by suggesting you add another product to your cart. It’s strategically positioned on your checkout page. They also cross-sell by showing you related topics to Python programming at the bottom.
12. Deals win-loss ratio
“A win/loss ratio compares your own opportunities against your lost opportunities to put wins and losses side-by-side.
Your win/loss ratio: # of won opportunities / # of lost opportunities
Why it’s vital:
It reveals the potential customer’s experience with your sales process.
Who benefits:
Reps can show value early on by developing customer relationships. Front-line staff can also build trust with prospects, listen to their needs, and implement solutions for them. They should also know how to refer them to other departments.
13. Seller productivity
Seller productivity is a KPI in sales that measures how effective your reps are. You can use this KPI to monitor their performance. You can also track your activities and analyze them to see if you’re making progress.
Why it’s vital:
It shows how productive your salesperson is overall. And it demonstrates how much work they’ve done and how much they can do in a day. By tracking your productivity levels, you can see where you need to put more effort to rock your sales.
Who benefits:
Sales reps can assess their productivity, and sales leaders can gauge their team’s performance.
14. Average profit margin
A sales rep’s profit margin is the difference between the cost of sales (e.g., commissions, travel costs, etc.) and the revenue they generate from those sales.
You can use this sales metric to understand each seller’s profitability.
Why it’s vital:
A high-profit margin seller can provide income for your company. Likewise, a low-profit margin rep can contribute to significant losses.
Who benefits:
Sales leaders and sellers
15. Sales rep revenue
This KPI for sales considers the total dollars the sales rep’s activities generate.
It allows your business to see how much revenue each salesperson contributes and reveals their efficiency.
Why it’s vital:
Revenue per rep also shows how much each rep contributes per client. It’s useful for indicating the overall impact of the seller’s activities.
Also, it shows how you perform against other reps in their area. And you can see if there are any trends that you need to address.
Who benefits:
Each seller and sales manager
16. New and expansion MRR
The “new and expansion” MRR KPI in sales breaks down your revenue sources. New MRR refers to extra revenue you add by increasing customer acquisition or reducing CAC. Expansion MRR is from existing buyers.
If you grow your MRR from one source, you could miss out on many other opportunities to expand your business.
Examples include
- new customers (e.g., signups, app installs, etc.).
- existing customers (i.e., purchases).
- referral partners (i.e., leads).
Why it’s vital:
By looking at MRR sources and tracking how each grows, you can see where you need to grow.
Who benefits:
Sales and marketing and sales leaders
17. Number of sales opportunities
The number of sales opportunities your reps create is the lifeblood of your business. By grasping this sales KPI, you can ramp up your team’s efforts to close more deals.
Why it’s vital:
You can identify roadblocks in your sales process early. And you can resolve teething problems, such as your marketing efforts, the quality of your leads, and the sales pitch.
Who benefits:
Analyzing this metric can help evaluate your pipeline’s health.
Let’s summarize the sales KPIs for each group in your organization.
Sales KPI template and calculator
You can now effortlessly track your sales metrics thanks to online sales KPI calculators and templates.
Here are some examples:
- Sales Performance OKR Guide and KPI Calculator –TTEC
- Free Sales Metrics Calculator- HubSpot
- Sales KPI Dashboards- Datapine
What are the key performance indicators in sales?
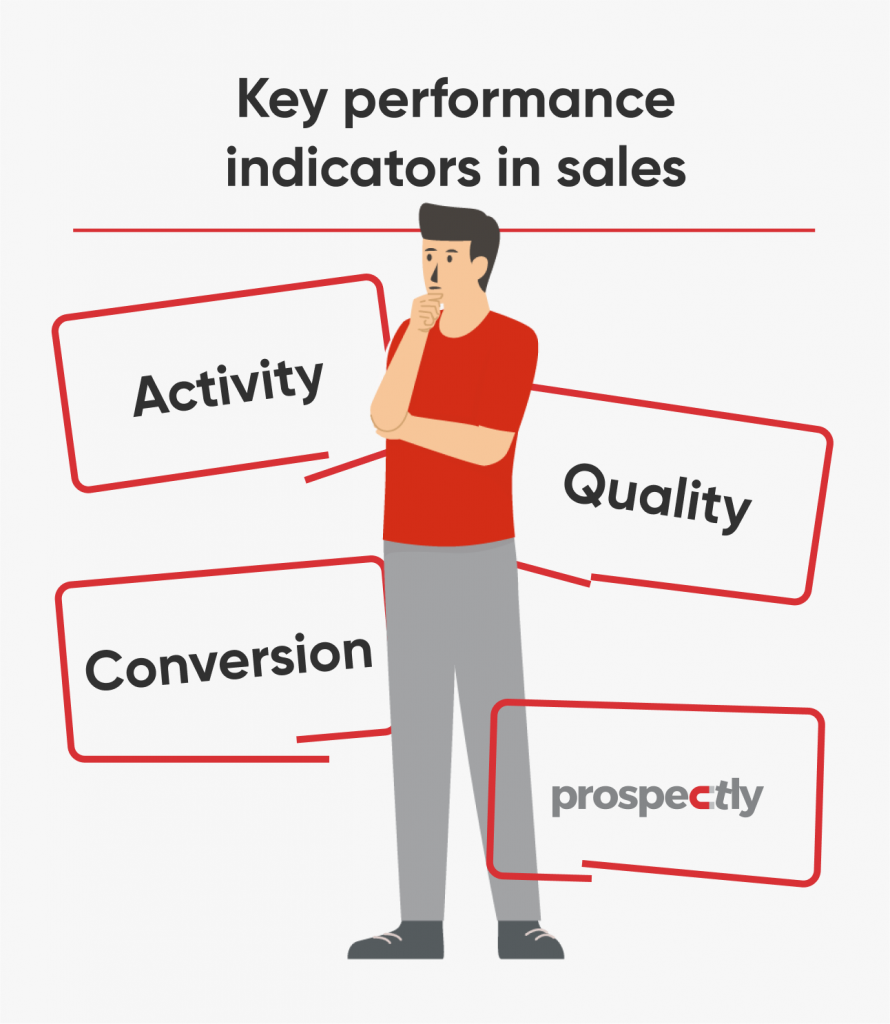
The primary KPIs for sales should respond to your needs. That’s because not every B2B sales KPI is vital for your business. Close.com suggests using the AQC (Activity, Quality, and Conversion) formula to track your KPIs.
Activity refers to your team’s daily activities to bring revenue to your company. And you can consider metrics, such as the seller’s performance, calls made, emails made, and revenue per rep.
Quality stands for the outcome of your salespeople’s activities. You can use metrics like the number of sales opportunities and open email rate.
Conversion assesses the final result of all your selling efforts. The conversion rate, quote to close ratio, etc., are some sales KPIs you can consider.
Also read: Sales dashboard definitive guide: Examples & templates

Related Stories
- September 23, 2022
- By Amen Mpofu
How-to guide: Solution-selling essentials for beginners
- solution selling
- solution selling benefits

Selling your ideas and products to customers has never been easier. With the rise of Digital Transformation, it’s harder than ever for e-commerce businesses to... Read More

- September 15, 2022
- By Shapnila Nath
Deciphering the classic conundrum: “Sell me this...
- sales interview
- sell me something
“Sell me this pen!” Does this question automatically transport you to the scene from The Wolf of Wall Street with Leonardo DiCaprio holding up a... Read More

- September 8, 2022
- By Amen Mpofu
Inside sales vs. Outside sales: Your questions...
- inside sales
- inside sales vs. outside sales
On the surface, inside sales and outside sales seem to follow similar principles. Both need a motivated, driven salesperson that can interact with customers over... Read More
