Super easy steps to create high-performing sales reports

Have you ever wondered what goes into producing a top-class sales analysis report? A report is only as useful as the information it conveys. Reports must be clear, accessible, and easy to read because they make your data easier to understand.
In this article, we’ll explore types of sales reports and demonstrate how you can build them for your team through simple steps.
What is a sales report, and why is it critical for your business?
A sales report is a document that summarizes the performance of sales activities. Sales managers must review sales analysis reports regularly. It allows you to keep track of current operations, make strategic decisions, and discuss trends with your team.
Without sales reports, you’re flying blind. Here are more compelling reasons why you need them.
- Sales reports help you understand how well your organization is performing against its goals.
- They also let you identify any problems before they become serious issues. For instance, you might see your sales figures drop compared to previous periods. This could indicate market changes, weak closing strategies, or customer dissatisfaction with your solution.
- Sales analysis reports help you make decisions about your sales team, marketing strategy, and future revenue goals.
- They can also help you identify trends in consumer behavior and predict their future buying habits.
- A sales report tells you whether or not your business is profitable and how much revenue it makes at different times during the year.
What should you include in a sales report?
You can show the following KPIs in your sales reports:
- Gross sales
- Net sales
- Revenue
- Average order size
- Leads
- Sales volume
- New accounts
- Costs per unit
- Conversion rate
A written explanation should accompany each metric to be meaningful. For example, if sales dropped by 10%, you need to clarify possible reasons for that. It helps your team grasp the push and pull factors and what they must do to improve.
Types of sales reports
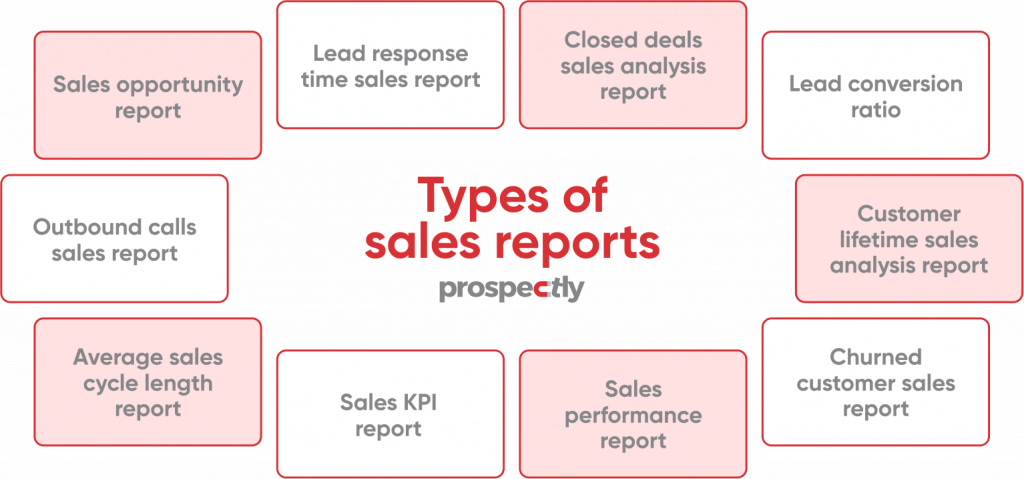
The following is a list of sales analysis reports you can prepare. Let’s kick off with daily reports which focus on sales operations.
Sales opportunity report by the rep
This document demonstrates how well your sellers convert an opportunity into a qualified lead. It can also show their success in moving that qualified prospect into the next step- a demo, a scheduled meeting, etc.
A low opportunity score could mean that the rep has substandard leads due to poor alignment with the marketing staff.
Lead response time sales report
How much time do your sellers take to follow up on a lead? The lead response time report lets you see whether their response is sluggish or ideal. However, you need to create a benchmark for your team on the expected response time.
At what point should they pursue a potential customer after they have signed up for a newsletter or downloaded an eBook? For example, reps need to urgently contact a prospect who has requested a demo.
Closed deals sales analysis report
You should also know the deals that have sailed through, ones that are stalling or have hit a brick wall. Successful deals reveal your expected revenue and that your closing strategies are working.
But a string of unsuccessful sales from a huge number of salespeople should worry you. You need to investigate the root causes to nip the problem in the bud. Perhaps your sellers have uninspiring sales presentation techniques.
Weekly reports are also vital for decision-making. Some examples include the following:
Lead conversion ratio
It’s a crucial metric that demonstrates your salespeople’s prowess to turn leads into paying customers. Your sales team can use this KPI to determine the number of leads they need to hit company goals. A low lead-to-conversion ratio could mean a fragile sales pipeline.
Outbound calls sales report
The number of outbound calls indicates the perfect weekdays for making those calls. For example, some studies have shown that days like Tuesdays, Wednesdays, and Thursdays have high response rates.
But through A/B testing and setting your benchmarks, you can determine the most promising call times and days.
Customer lifetime sales analysis report
How much do you expect to earn per customer? The customer lifetime sales analysis report provides you with the details. It reveals whether the average is skyrocketing or falling – your goal is to maintain a stable lifetime value.
Finally, let’s zoom in on the monthly reports you need.
Average sales cycle length report
Want to know the amount of time it takes for each seller to close a sale? You need to prepare the sales cycle length report. Also, it demonstrates your reps’ performance and your sales process’ effectiveness.
However, establish a standard for your team to help you evaluate their progress. Review your training, sales process, sales methodology, etc., if your sellers struggle with meeting the set guidelines.
Sales KPI report
This monthly report or sales dashboard is handy for sales managers because it contains primary metrics. Examples include the number of sales, revenue, profit, costs, churn ratio, up/cross selling rate, etc. They give executives, sales VPs, and leaders an overview of the company’s performance.
It influences your sales strategy- a persistent revenue drop calls for a radical approach to rescue the situation.
Sales performance report
Use this sales analysis report to visualize current opportunities, purchase value, win ratio, average purchase value, etc. It enables you to compare your present performance with your past month. And you can tell if your sales efforts are bearing positive results.
Churned customer sales report
Churn is defined as the percentage of customers who leave in a given period. The higher the churn rate, the greater risk to your company’s survival. Churned customers are a huge problem for your business because they represent lost revenue and potential referrals.
A churned customer sales analysis report can be helpful:
- It identifies trends in your customer base. You get insight into what types of customers are leaving and how often they’re doing so.
- It helps you understand what’s driving the attrition rate for each business segment. You can focus on the areas that need improvement.
- It offers insight into any additional products or services that you need to keep buyers from leaving.
Also read: Why ignoring key sales metrics will cost you time and sales
5 steps to creating top-notch sales reports
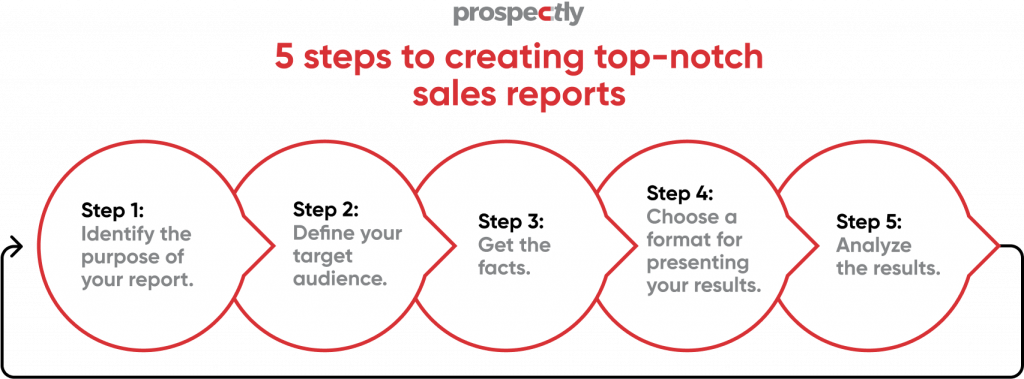
If your sales reports aren’t up to snuff, they won’t be very useful. Here are five steps for creating top-notch sales reports that’ll help you make better business decisions:
Step 1: Identify the purpose of your report.
Sales analysis reports provide details on the sales process and its results. They help you determine future sales activities and keep management aware of business performance. For these reasons, decide on the report’s objectives.
Do you want to enhance sales performance? Is it about motivating your team? Are you interested in identifying consumer trends?
Do you want to improve customer service? Are you trying to identify the most popular products? Or do you just want general info about how well things are going?
For example, you need to include revenue details if you want to convince your sales manager to invest more in digital marketing. Show how much each digital channel will bring in relative to its cost. It’ll enable your boss to determine which ones are cost-effective.
Once you know what you want to achieve, it’ll be easier to select the data you need and the best way to present it in your report.
Step 2: Define your target audience.
Who is your target audience? What are their needs and what do they expect to see in a sales report? It can be an individual, sales team, or a group of employees, such as the board of directors. For example, if you’re writing a report for the CEO, they may want more details about market trends and competition.
When will they read it? Your readers will need enough time to digest monthly reports before you send out the next one. Weekly reports should include only those relevant items in that week’s sales cycle.
Step 3: Get the facts
The third step to writing a sales analysis report is to gather all of your facts. What do you want to know about your sales? Based on previous events, do you need any details before making any decisions?
What core metrics do you want to include? Consider KPIs like number of sales, revenue, customer acquisition costs, new opportunities, etc.
Step 4. Choose a format for presenting your results.
Different formats for presenting sales reports include tables with numbers, graphs, charts, and narrative text (a written description). You may want to use more than one presentation type to emphasize critical trends or patterns.
For example, if some months show higher sales than others, you can include tables that show the totals for each month. Blend them with graphs to indicate quarterly totals to see short-term fluctuations and long-term trends more clearly.
More importantly, use colorful visuals. They make it easy to grasp and digest the info.
Step 5: Analyze the results.
It’s time to analyze the data and see what conclusions you can draw from it. When analyzing data, don’t just look at averages — look at individual KPIs, and trends over time or between different categories. It helps you get an accurate picture of how things are going overall.
Add a context to the numbers to enable your audience to understand what’s happening. For example, explain why sales went down in one week or month.
Tips to enhance your sales reports
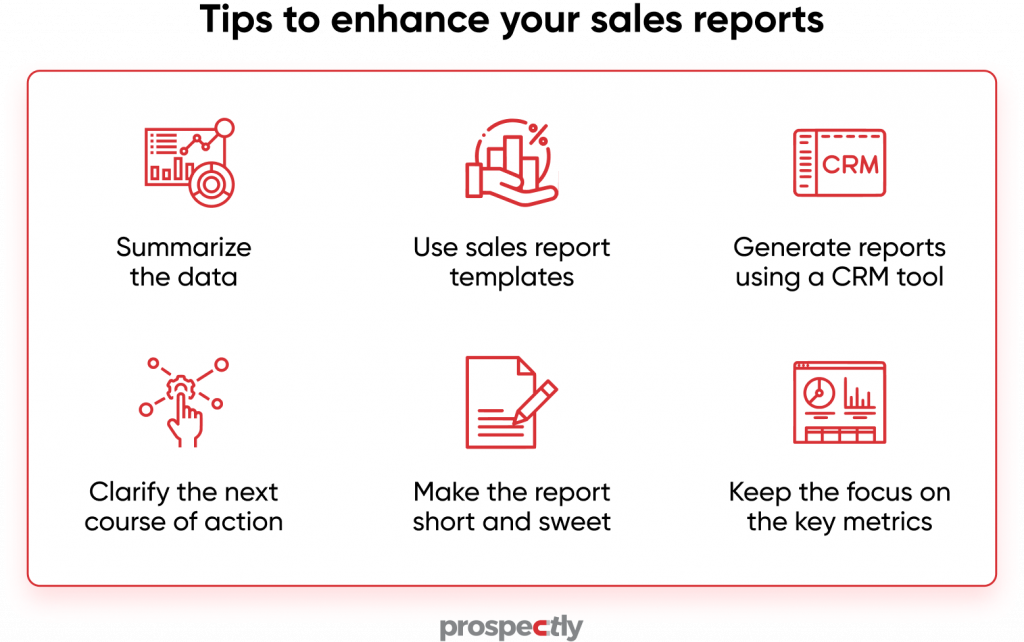
Summarize the data
Once you have organized your data, it’s time to summarize it into one document. Highlight the key takeaways and explain to your readers what they can expect to learn.
Include the following details:
– A clear overview of the company’s performance in terms of revenue, profit margins, cost of goods sold, etc.
– A detailed analysis of the company’s performance in different markets/regions with a comparison to last year’s results.
– The profitability of each product line, including the market share and growth rates.
– The company’s market position with a comparison to its competitors and its own history.
A concise report helps top management get all the info they need quickly when they’re pressed for time.
Use sales report templates
Consider using sales report templates because they offer an excellent structure. Check out the following examples.
Generate reports using a CRM tool
CRM software can help you produce colorful and visual reports in no time.
Clarify the next course of action
After compiling your sales analysis report, describe the next steps to deal with the challenges you noted. For example, outline your action plan to fix falling revenue, weak closing techniques, high churn rate, etc.
Make the report short and sweet.
Don’t overcomplicate it—keep it brief. Ensure the information you’re presenting is clear and easy to understand at a glance.
Keep the focus on the key metrics.
Your goal should be actionable items—you need to know what’s working. Numbers give you the exact picture of your sellers’ and company’s performance.
Ask yourself these questions:
- What makes you so sure that you’re right on target?
- Is there any way to remedy this situation? How?
- Explain the increases and the decreases.
- How can you deal with those challenges?
Continue to improve a successful outcome and minimize the damage.
Create world-class sales analysis reports
Ultimately, it’s the sales managers who gain the most from sales analysis reports. You can use this information to retool your sales strategy for maximum effectiveness.
Sales reps will need to change with the times to put the right strategy into practice. And executives can use this data to make better business decisions, even if they’re indirectly involved in the sales process.
Also read: Sales dashboard definitive guide: Examples & templates
Don’t forget to share!

Related Stories
- September 29, 2022
- By Amen Mpofu
17 Critical Sales KPIs Every Business Should...
- key performance indicators
- KPIs in sales

Sales KPIs are vital for your business. If you can’t measure success, you can’t know whether you’re on track to achieve your strategic goals. To... Read More

- September 23, 2022
- By Amen Mpofu
How-to guide: Solution-selling essentials for beginners
- solution selling
- solution selling benefits
Selling your ideas and products to customers has never been easier. With the rise of Digital Transformation, it’s harder than ever for e-commerce businesses to... Read More

- September 15, 2022
- By Shapnila Nath
Deciphering the classic conundrum: “Sell me this...
- sales interview
- sell me something
“Sell me this pen!” Does this question automatically transport you to the scene from The Wolf of Wall Street with Leonardo DiCaprio holding up a... Read More
