Sales dashboard definitive guide: Examples & templates
Sales reps need to monitor their accounts and sales numbers to know if they’re in line with their targets. A sales dashboard provides them with an overview of the crucial metrics of their performance. Sales managers can also use this information to plan their daily activities and prepare reports for senior management to improve performance.
Scroll on for more details to discover how to create your sales dashboard by following top examples and templates.
What is a sales dashboard?
A sales dashboard is a single screen displaying all the essential information about a salesperson’s success. In one glance, it offers a complete picture of all the data involved in the sales process. The report includes metrics like opportunities, conversion rates, revenue, pipeline forecasts, etc.
Let’s dive into more reasons why account executives, sales team management, and salespeople need a sales dashboard.
Sales dashboard importance
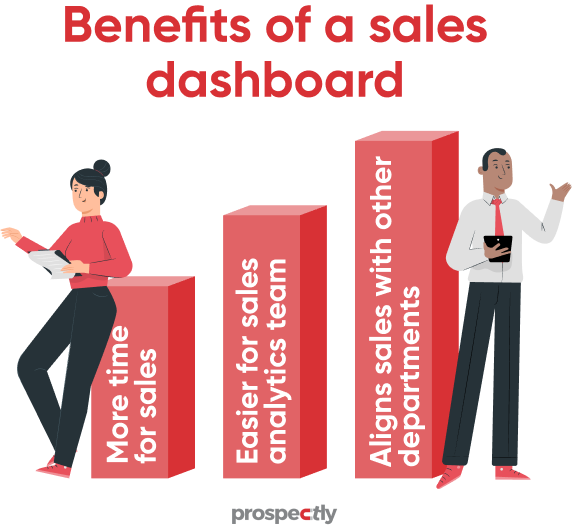
What is the purpose of a sales dashboard? A sales dashboard has the following benefits.
Frees up more time for salespeople
Typically, sellers use CRM software to see how well they close their deals. But in most cases, they may fail to get the complete information due to using several tools as data sources. Also, it’s time-consuming to search for data on various platforms.
A sales dashboard can come to the reps’ rescue by pooling all the statistics in one place and offering a single view. As a result, it saves them time on administrative tasks and looking for info everywhere. Sellers can concentrate on prospecting and selling.
Makes the sales analytics team’s work easier
The sales analytics team needs to export data from a CRM tool to analyze it. Again, this takes time, and human error can lead to incorrect data. Also, information on spreadsheets quickly becomes outdated and remains static.
However, creating a centralized source of truth through a sales dashboard keeps the data fresh. And everyone on the sales team can make decisions based on the same information.
Aligns sales with other departments
Alignment between sales and other key departments, like marketing, is critical for your business’s success. Sales dashboards help managers, senior sales managers, and sales reps focus on the common metrics.
Everyone will know what they must do. Each salesperson can see their performance vs. their quota or goals, and managers can efficiently distribute resources. Sales analytics teams can also create accurate forecast reports.
Overall, sales performance and revenue improve.
What should a sales dashboard include?
A sales dashboard helps you visualize your sales funnel, so it should have graphs and charts. It may also have a section next to your KPIs with notes to clarify what the numbers mean. And a text box with suggestions and sales insights may be one of the features.
Sales dashboard metrics
Earlier, we mentioned some metrics that a sales dashboard can show you. Here are more examples.
- Regional sales
- Average purchase value
- Quote-to-close
- Deals in the pipeline
- Average order value
- Sales per salesperson
- Opportunities
- Sell-through rate
- Follow-up rate
- Sales target
- Sales to date
- Lead conversion rate
Must you consider all these KPs? Let’s answer the question by jumping into how you can set up your sales dashboard.
How do you create a sales dashboard?
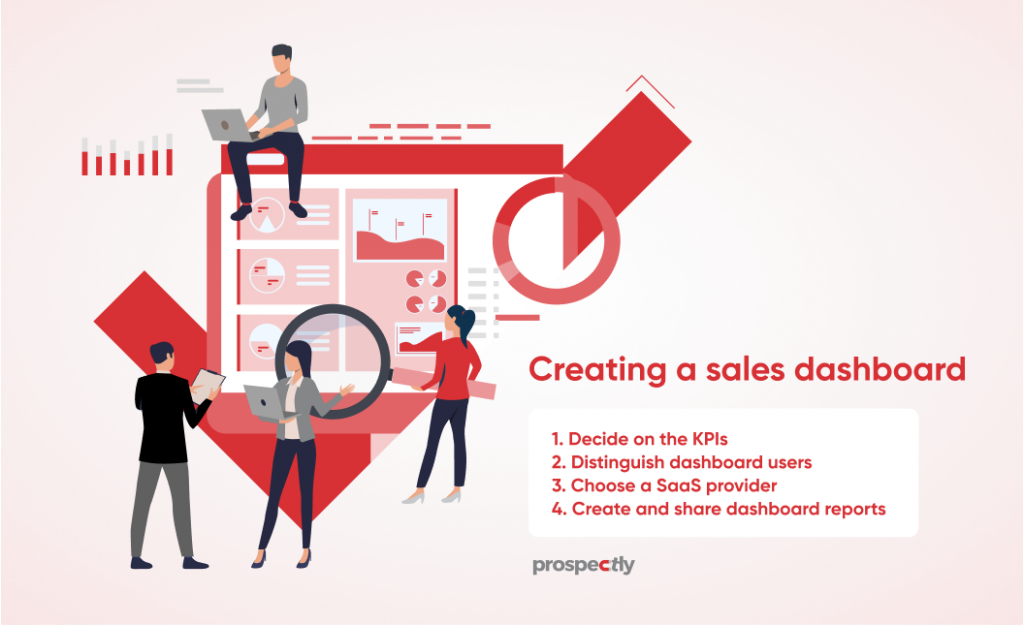
Decide on the KPIs you want to monitor
A sales dashboard provides you with real-time data on your team’s sales performance. But tracking too many metrics could be overwhelming and confusing. So, determine the key numbers crucial for your company and salesforce. Here are some questions to consider.
- What KPIs do your company regularly assess in individual or sales team meetings?
- How important are some metrics over others?
- In what ways do you measure your performance (KPIs)?
- Is your sales organization divided into multiple sales teams?
Answers to these questions can help you figure out the essential stats you need to track. And here are some primary metrics you may zero in on in your sales dashboard:
- Sales activity metrics
- Conversion sales metrics
- Pipeline sales metrics
Distinguish the sales dashboard users
We’ve already said sales managers, reps, senior management, and account executives can benefit from a single data source. However, it’s also critical to identify sales dashboard users. For example, sellers can use it to keep tabs on their goals, while managers can evaluate performance.
Also, consider the specific metrics each group will track and how often they’ll do it – weekly or monthly, etc. And how much info will the dashboard include?
Choose a SaaS (Software as a Service) provider
Select a vendor once you work out the users and the statistics vital for your team. You may not need a separate tool if your current CRM offers a comprehensive sales dashboard. If you don’t have one, here are some apps you can integrate with any platform.
HubSpot CRM comes with sales dashboards and reports. You can sync your data with multiple devices and software.
Zoho Analytics is also a handy sales dashboard software provider with custom reports and charts.
Visible lets you create the reports you need to analyze your sales data.
GoodData is a cloud-based platform that handles huge volumes of data. It allows you to produce, store, evaluate, and share info.
Tableau is a desktop tool that makes it easy for anyone to visualize and analyze their data and create dashboards.
Sisense is perfect for small and mid-sized businesses that want to customize dashboards, create visual reports and share with team members.
Create and share your sales dashboard reports
You’ve got various ways of producing reports for your sales dashboard to distribute to other stakeholders. They include:
- Line charts and column charts to show trends about revenue, etc.
- Waterfall charts, bar charts, and pie charts indicate composition, like sales per region or rep.
- Line graphs, pie charts, and bar graphs can also provide info to compare values, such as sales by product.
Sales dashboard examples
We want to dive into sales dashboard examples and templates to inspire you.
Sales pipeline dashboard
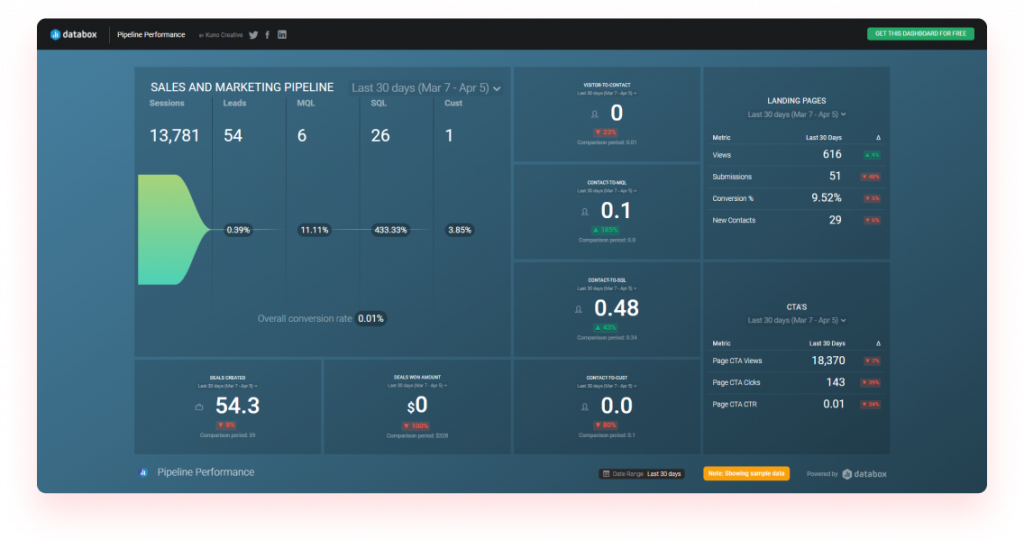
Sales pipelines are a way of organizing and visualizing sales opportunities. Sales pipeline dashboards can help by viewing the pipeline’s stages and detailed information about each step.
Pipeline dashboards can provide valuable insights into how your sales team is performing and how you can improve it. They also provide an easy-to-read overview of your pipeline’s health at any given time.
Metrics
- Opportunity stages
- Opportunities by sales rep and size
- How to move forward with deals, their age, and timeline of deals
- KPIs tailored to your needs, like product types, team involvement, etc.
Purpose: It’s a perfect sales dashboard to understand the health and status of your pipeline.
Users: Managers, sales analysts, and executives
Related: The Sales Pipeline Master Guide: How to Build, Manage, and Measure
Salesperson’s dashboard
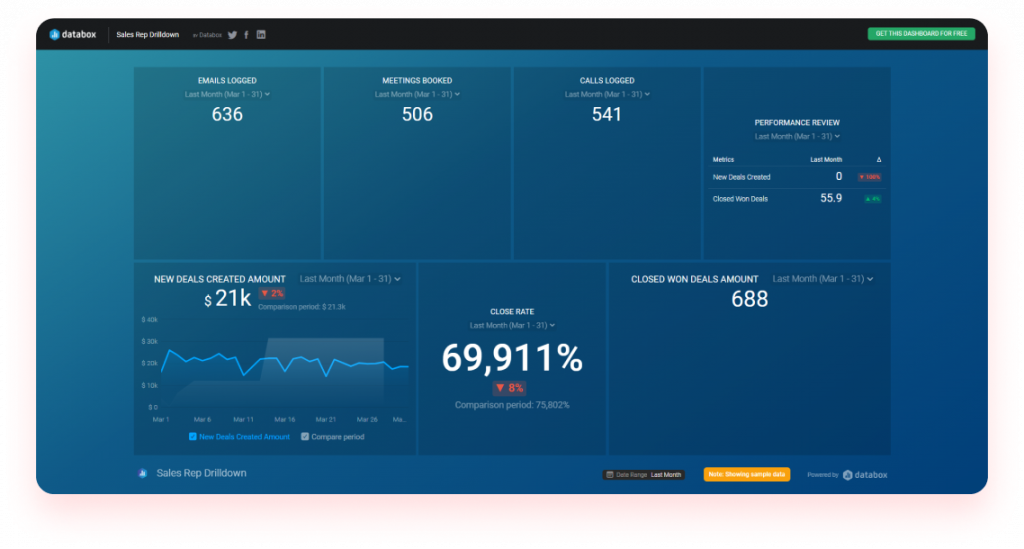
A sales dashboard is a platform that helps sales reps track their sales performance. It provides them with a way to measure their success or failure at any moment. Also, it provides them with insights into how they can improve their performance in the future.
Sales reps can use dashboards for various purposes. One of the most common uses is to track the number of leads they generate and follow up on each day. Sellers can monitor how many conversations they have with prospects, how many meetings they set up, etc.
Metrics
- Open opportunities
- Meetings booked
- Forecast
- Deals in pipeline
- Sales cycle length
Purpose: Sellers can use it to monitor their sales activities.
Users: Individual sales reps
Sales territory dashboard
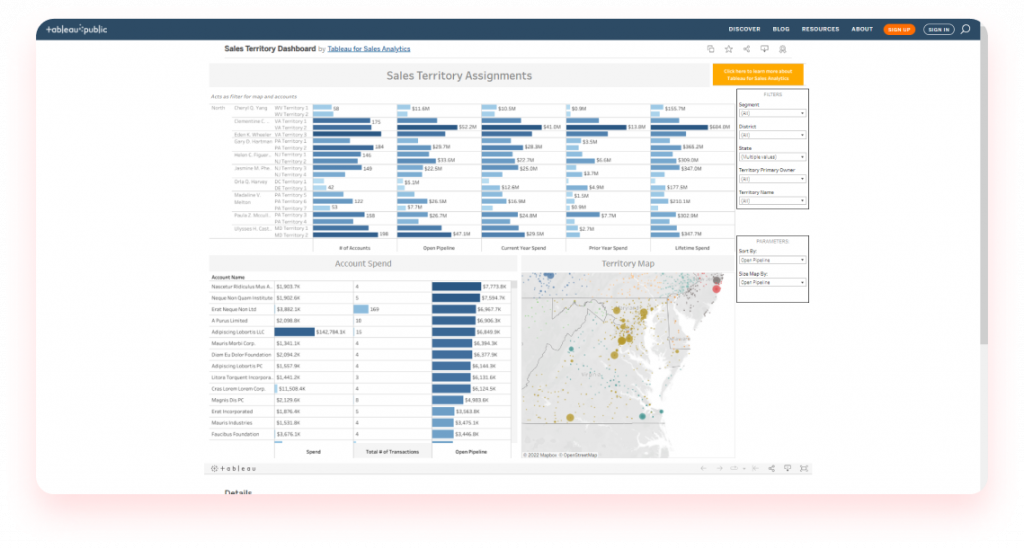
A sales territory dashboard provides an overview of the sales team’s performance in a given region. It allows for quick analysis and comparison of data, identifying trends, and making informed decisions.
You can use the dashboard to track regional performance, analyze regional trends, or identify opportunities.
Metrics
- Territory map
- Prior year spend
- Lifetime spend
- Account spend
- Budget for the current year
Purpose: Use this dashboard to grasp the KPIs that influence your sales by region.
Users: Managers and team leaders
Account executive dashboard
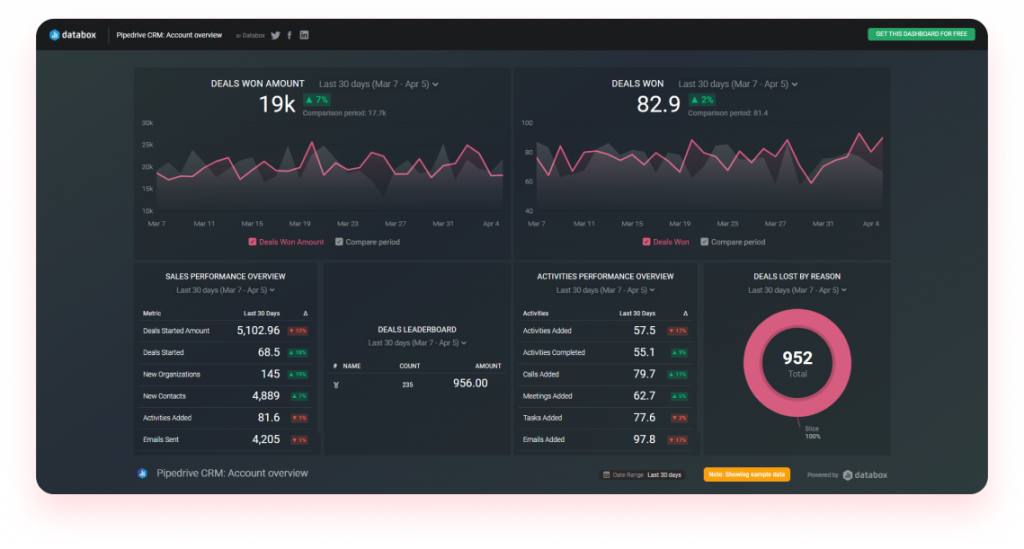
An account executive dashboard enables account managers to keep track of their work and their team’s work. They can also organize and prioritize their tasks. Leaders can use dashboards to quickly assess what is happening in the company and how each department is performing.
Managers can see how they are doing against their goals, how teams perform against targets, and whether they need to take any corrective action.
Metrics
- Dollar amount of deals won
- Growth opportunities resulting from organic traffic
- Deals leaderboard
- Deals lost by reason
- Overview of activity performance
Purpose: Use this tool to create goals based on the reps’ or team’s performance.
Users: Sales managers and analysts
Sales conversion dashboard
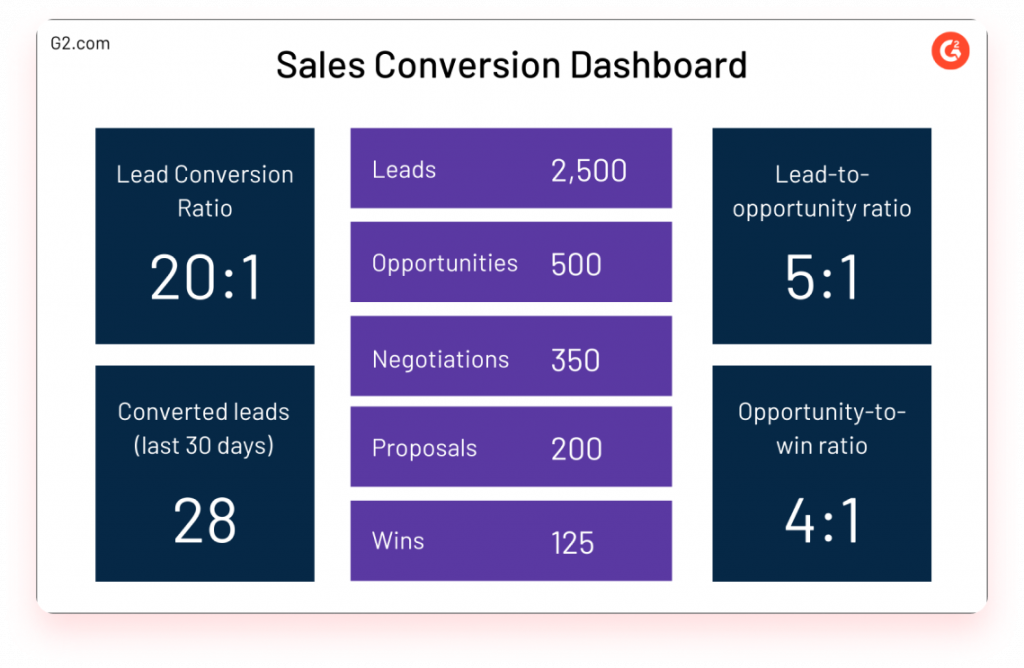
A sales conversion dashboard is a robust platform for sales teams to measure the effectiveness of their campaigns. It helps them find out what is working and needs improvement, enabling them to allocate time and resources accordingly.
Metrics
- Lead-to-opportunity ratio
- Opportunity-to-win ratio
- Conversion rate
- Loss rate
- Churn rate
Purpose: You can use the sales conversion dashboard to determine how your team converts leads to buyers.
Users: Sales managers, sellers
Sales activities dashboard
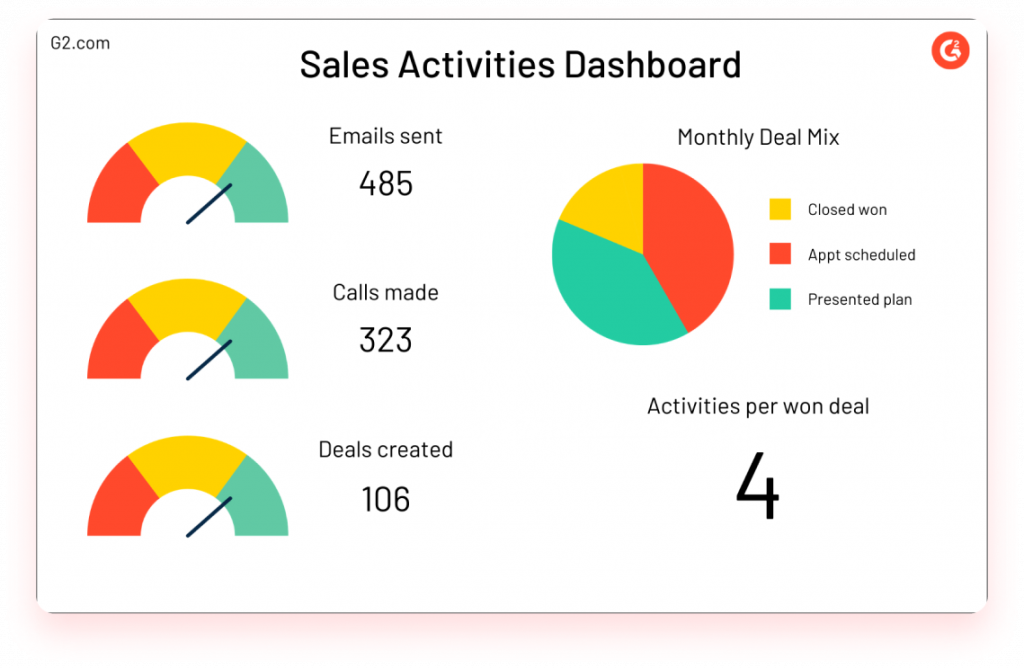
A sales activities dashboard helps leaders see the sellers’ daily activities. It gives insights into the sales team’s progress to focus on what they need to do to close more deals.
Metrics
- Average deal size
- Emails sent
- Calls made
- Deals created
- Activities per won deal
Purpose: Use this dashboard to get inside info about what sellers do day by day to close more deals.
Users: Sales leaders
Leads overview dashboard
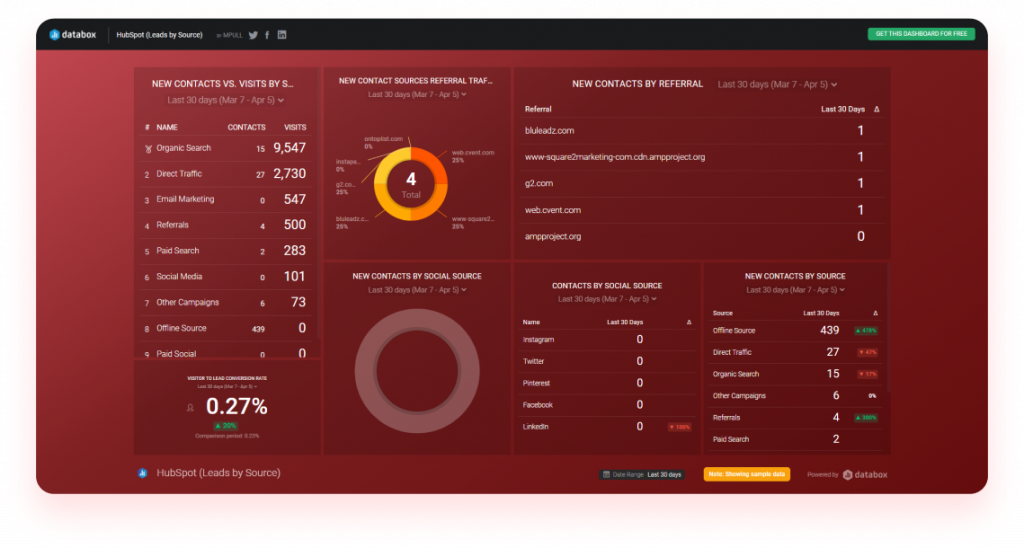
A lead overview dashboard has one primary goal – monitoring and analyzing data about its leads. It shows the type of leads, how many, and how often they arrive. You can use this information to decide how best to move forward with outbound marketing efforts.
Metrics
- Sources of new leads
- Status of new leads
- Lead owner
- Lead conversions
- New cases
Purpose: Use the dashboard to overview new opportunities and conversion rates.
Users: Sales leaders, sales team management
Sales cycle length dashboard
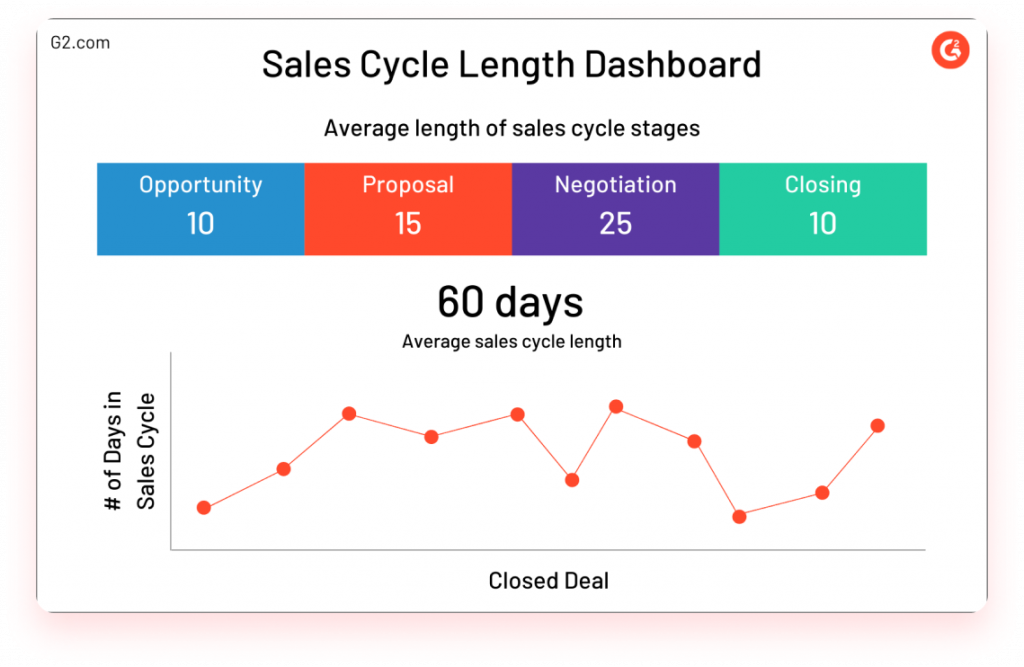
The sales cycle length dashboard tracks the number of days for each sales stage to complete. It helps business owners and managers understand their sales process and identify which steps take longer than they should. Also, it provides a visual overview of the sales cycle to see where there are delays and how much time sellers waste.
Metrics
- Average sales cycle length
- Average length of sales stages
Purpose: It’s a perfect dashboard that helps to shorten your sales process.
Users: Sales managers
Key performance indicator dashboard
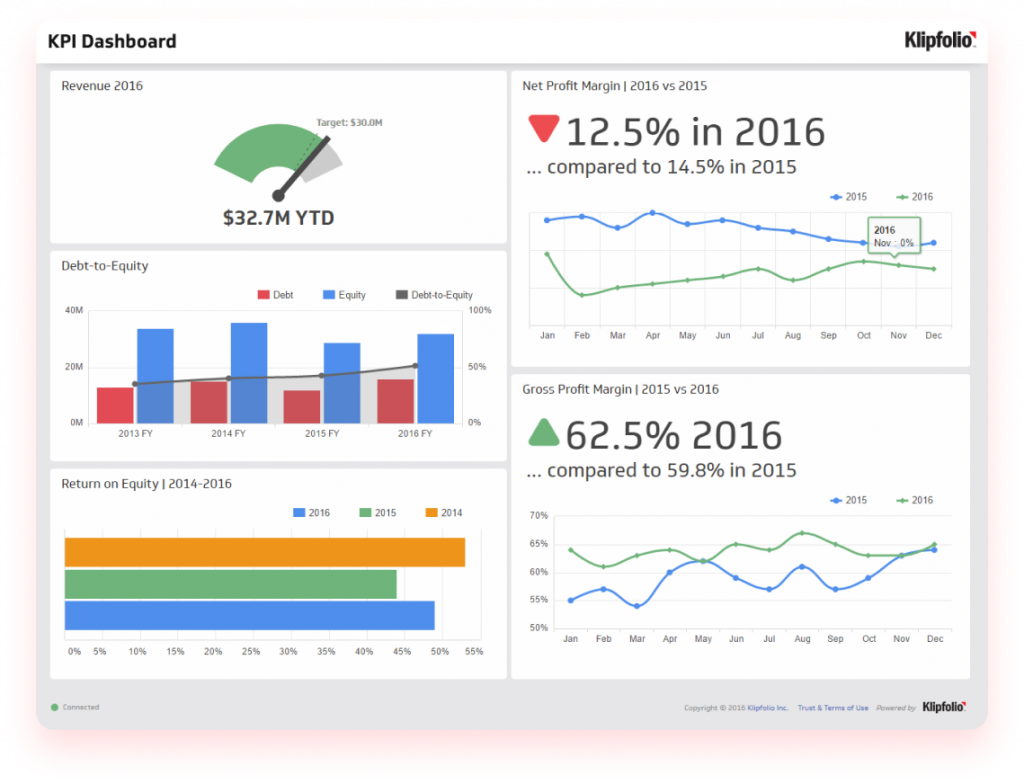
A Key Performance Indicator (KPI) dashboard is a visual display of the most critical metrics for a business. It helps sales leaders understand how well the company is doing its objectives.
The KPI dashboard tracks progress towards goals and identifies areas that need improvement. It can help measure success by providing visibility into which KPIs are working and which ones you need to improve.
Metrics
- Average impressions
- Product sales in dollars
- Sales count by state
- Average ACoS
- Total sales
Purpose: You can use the KPI dashboard to have a bird’s eye view of the primary metrics of your company.
Users: Account executives and managers
Sales product performance dashboard
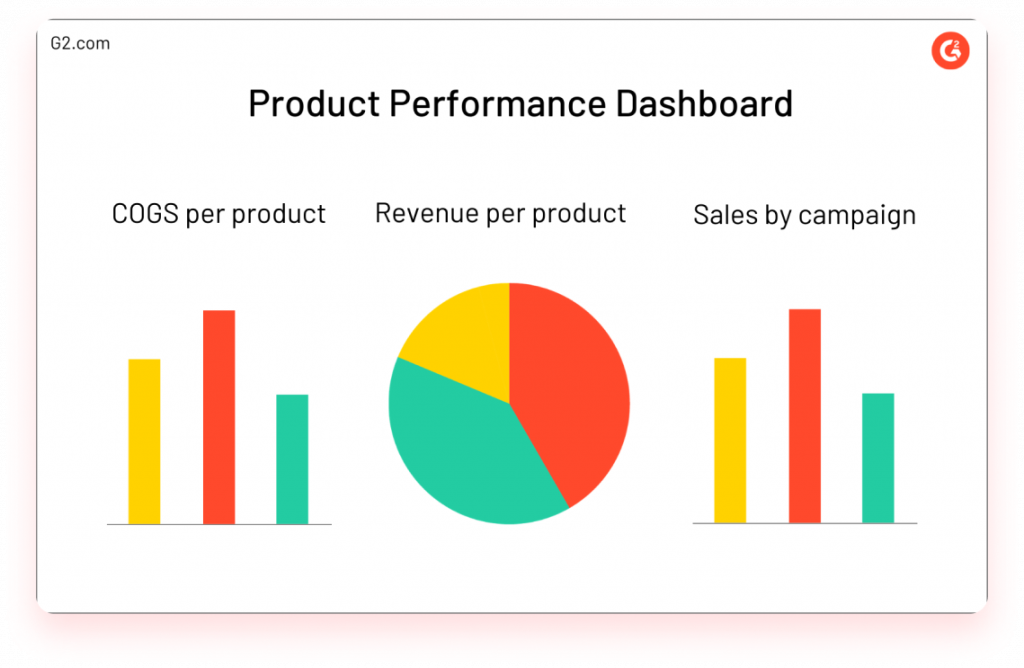
The Sales product performance dashboard helps the sales team manage and track products. It contains sales pipeline data, opportunities, and product performance data to help you decide what products to sell or stop selling.
The information on the sales pipeline helps the team determine if they are following up with potential customers at a good time. Finally, it includes opportunities, which give reps an idea of how much progress they have made in closing deals with potential customers.
Metrics
- Product Performance
- Cost of Goods Sold
- Point of Purchase
- Sales Growth
Purpose: Use this dashboard to determine whether you’re selling the right product to the right people at the right place.
Users: Sales teams and managers
Final thoughts
The sales dashboard is a tool that enables managers to keep track of their team’s performance. It provides a way to monitor their reps’ number of leads, meetings, and calls and deals closed. Also, it tracks where sellers are in the pipeline, what deals are coming up, and how much money they make.
Sales dashboards allow you to have a bird’s eye view of your business. As a result, you can know what needs your attention and where you need to be spending more time. Senior management can use dashboard reports to make strategic decisions about the direction they want their company to take.
Related: Why ignoring key sales metrics will cost you time and sales

Related Stories

- September 29, 2022
- By Amen Mpofu
17 Critical Sales KPIs Every Business Should...
- key performance indicators
- KPIs in sales

Sales KPIs are vital for your business. If you can’t measure success, you can’t know whether you’re on track to achieve your strategic goals. To... Read More

- September 23, 2022
- By Amen Mpofu
How-to guide: Solution-selling essentials for beginners
- solution selling
- solution selling benefits
Selling your ideas and products to customers has never been easier. With the rise of Digital Transformation, it’s harder than ever for e-commerce businesses to... Read More

- September 15, 2022
- By Shapnila Nath
Deciphering the classic conundrum: “Sell me this...
- sales interview
- sell me something
“Sell me this pen!” Does this question automatically transport you to the scene from The Wolf of Wall Street with Leonardo DiCaprio holding up a... Read More
